How to Find a Sample Standard Deviation with Mean
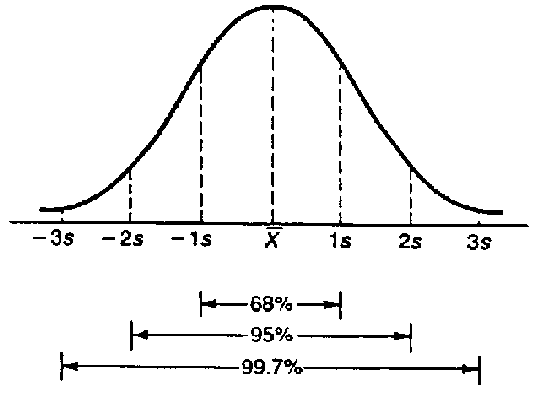
Statistical analysis is used to interpret different information that can be retrieved from a set of raw data. The trend determination and the interpretation of the noisy data which has no useful meaning for the users can be found with the help of the statistical analyses. Mean is known as the average of the entire data. It is useful to understand the overall performance which can be associated with a particular set of data. Similarly, there are some outliers which don’t follow the usual trend like the average time taken to reach office for Jones is 20 minutes but on a couple of occurrences in a month, it took him 50 minutes to reach the office due to traffic jam. It will definitely distort the overall results so you just omit the outliers that are unlikely to be a realistic figure. Standard deviation is something that predicts the variation and dispersion that the data possesses compared to the average or mean figure. If the standard deviation is low, it means the differences between the original values are their mean has very less variation; they lie close to the mean. If it is high, it means that the mean is not the right representative of the data as the original figures doesn’t lie close to it and vary considerably.


Instructions
-
1
Consider the following data that will help you to understand the calculation of mean and standard deviation better:
Time taken to reach the office (in minutes): 20, 22, 24, 18, 16, 20, 20, 21, 23, 19, 19, 40, 25, 22 and 18.
Stated above is the data that represents the time taken by Jones to travel to office for the first 15 days of February. As you can see that on the 12th day, Jones spent 40 minutes which is quite different from the rest of the range so it is an outlier and will not be included in the calculation of the mean as well as standard deviation. -
2
Calculate the mean of the data. Add all figures and divide by the total number of figures in the data.
Mean = (20+ 22+ 24+ 18+ 16+ 20+ 20+ 21+ 23+ 19+ 19+ 25+ 22+18)/14
Mean = 287/14 => 20.5 minutes -
3
Now list the deviations from the mean in the following manner:
Figure Mean Deviation
20 20.5 -0.5
22 20.5 1.5
24 20.5 3.5
18 20.5 -2.5
16 20.5 -4.5
20 20.5 -0.5
20 20.5 -0.5
21 20.5 0.5
23 20.5 2.5
19 20.5 -1.5
19 20.5 -1.5
25 20.5 4.5
22 20.5 1.5
18 20.5 -2.5 -
4
Square the deviations:
Deviation Square
-0.5 0.25
1.5 2.25
3.5 12.25
-2.5 6.25
-4.5 20.25
-0.5 0.25
-0.5 0.25
0.5 0.25
2.5 6.25
-1.5 2.25
-1.5 2.25
4.5 20.25
1.5 2.25
-2.5 6.25 -
5
Sum the squared deviation: 81.5
-
6
Take the square root of the number: 81.5^0.5 = 9.02
Standard Deviation = 9.02