How to Create a Chart in Microsoft Excel
Microsoft Excel makes it possible to construct various types of charts and graphs for a visual display of information on the basis of given data in the tables. For example, you can build a histogram that displays the performance of employees in a firm.
Microsoft Excel not only gives you an opportunity to work with the text but also with charts and graphics. If necessary, the user can always insert a graph, diagram or a chart. However, you need a little understanding of the program to create a chart.
You can make pie charts which is one of the most convenient ways for the perception of numerical information or line charts through which you can make the subsequent comparative analysis of graphical data.


Instructions
-
1
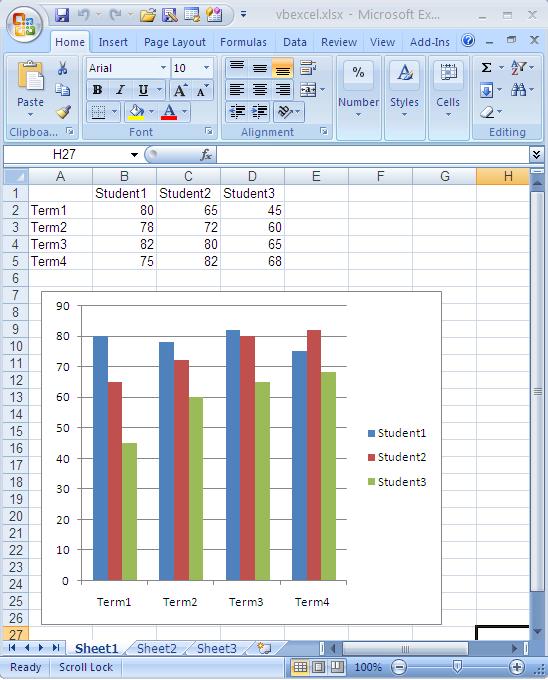
Launch Microsoft Excel and load the spreadsheet containing the data to plot, or create a new document and fill it with the necessary data.
So, the first step is to create a table in Excel with two columns containing data. -
2
Select the tab "Insert" from the menu and then click on the icon "Chart", placed in command group "Diagram". In the popup list, among the seven design options, select the most appropriate one.
The 'Table Editor' will create a chart based on your chosen layout, after reviewing the data that you provided in the selected cells. -
3
Use the table editor option to create the chart when it is needed. To do this, click on the tab "Designer" and select "Chart Styles" and "Chart Layouts" from the drop-down lists.
You can also create your own version of the graphic design by using the tabs "Format" and "Layout" tools. -
4
If you are not comfortable with tools on the panel, right-click on the chart and click the appropriate menu command.
To change the appearance of the chart, click the drop-down menu, select "Format Chart Area".
A new dialogue box will open where you can set the boundary of the diagram, choose a background image, or can use different shadow effects. -
5
Save the edited version of the graphic design, if you want to use it in the future.
-
6
If you want to make some changes to an already created chart, select it from the available menu "Working with Diagrams" and make use of the three tabs "Design," "Layout" and "Format". Use the available tools to make the chart in accordance to your needs.


