How to Draw a Distance Time Graph
It’s only few more days to go for your final exams and if you happen to be a science student then there might be a few things you need to work on. Talking about science subjects, there are so many things that keep confusing you despite the fact that you have tried everything to learn and understand them. One such topic is related to Physics and is called Distance-Time Graph which may prove to be confusing if this is the first time ever you are preparing for a Physics exam. As the name implies, the Distance-Time graph actually shows a relation between distance travelled by a body and the time it has taken. In other words we can say that a Distance-Time graph used to find the velocity of a body with respect to distance and time. This article will guide the students on making a simple Distance-Time graph.


Instructions
-
1
Units of Time & Distance
Keeping in view that in a Distance-Time graph, the distance is expressed in meters and time in seconds, try to measuring a distance of 100 meters on a straight road or a path. -
2
Covering distance in specific time
Either by yourself or someone else, try covering the measured distance by walking or cycling on the path and note the time taken to cover the distance in each case. -
3
Make the readings
If it has taken you 75 seconds for instance to cover the distance of 100m, then by using a stop watch note the distance you cover in every 15 seconds. You may get the following results upon measuring:
Time in seconds 0 15 30 45 60 75
Distance in meters 0 20 40 60 80 100 -
4
Plotting the Graph
After you have obtained the above readings now plot them on a graph paper. Take 1 cm to represent 5 units both on x and y-axis of your graph.

-
5
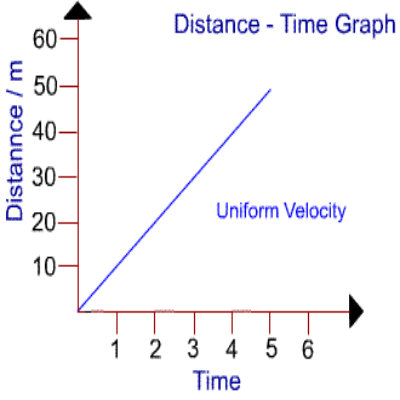
Finding Velocity from the Graph
Upon plotting you will see that your graph is a straight line starting from the origin. Keeping in mind that the formula for calculating Speed is Distance divided by Time, so wherever you will apply the formula you will get same result that is 1.33 m/s. This is because the straight line in Distance-Time graph represents uniform speed.


