Difference between Regression and Anova

It is extremely hard to distinguish between regression and Anova (analysis of variance) as both are the statistical techniques which are used to measure the outcome of the continuous variables and share a lot of similarities. However, there are few differences between the two terms.
A regression model is always based on continuous independent variables. On the other hand, Anova is based on categorical independent variables. Moreover, there is only one error term in regression while Anova can have more than one error terms.
Regression models are extensively used to forecast and predict the future outcomes. Besides, they help to interpret the relationship of independent variables with the dependent variables. On the contrary, Anova is used to analyse the difference between means of different groups of variables.
Instructions
-
1
Regression
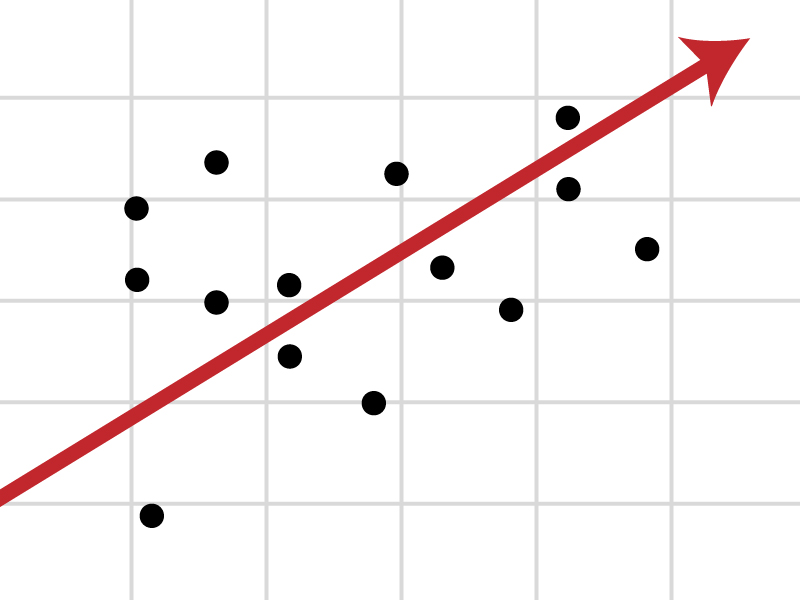
It is one of the most widely used statistical technique which helps to understand the relationship amongst variables. It shows how an independent variable is related with a dependent one by showing it on graph. Mostly, regression analysis is conducted to get knowledge about the change in the dependent variable, resulting from one unit change in independent variable, in order to make predictions about the future consequences.
It can also be used to understand casual relationships amongst independent and dependent variables. There are many different methods which are used to conduct regression analysis, one of which is linear regression which is mostly used by firms to make predictions about their production and revenues. Some other methods include, ordinary least squares and parametric regressions, which have limited use.

-
2
Anova
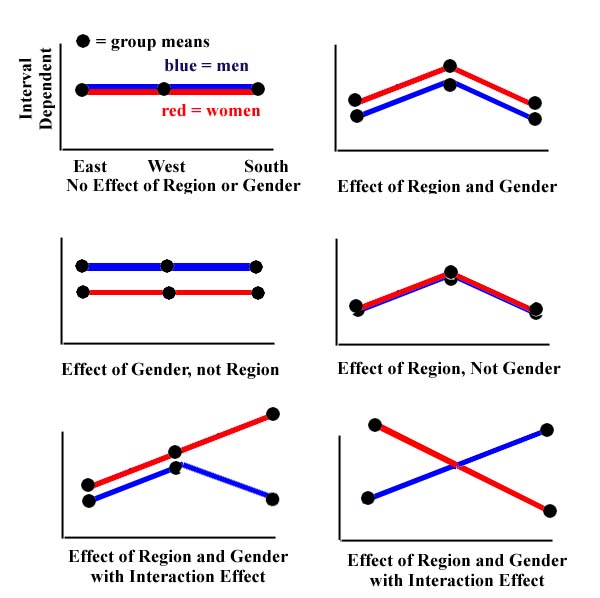
It is set of statistical models which are used to understand the diversity between group means, and their related procedures (e.g. variation between groups) in which the variance that is observed in a specific variable, is divided into parts, attributable to a number of sources of the variation.
It is generally used to test the hypothesis formed by researchers so as to check the validity of their research. If the hypothesis is not proven correct, the researcher goes back to form another hypothesis and tests it. In this way, he/she can ensure the validity of his/her research through mathematical means. It can also be used to test the null hypothesis by analysing the differences between the group means.
It is very difficult to test the hypothesis manually. However, there are many statistical software which can be used to test the hypothesis through Anova.


